 It’s extraordinary to watch the flow of information and knowledge worldwide. You could trace the evolution of media arts over the past years as not so much the introduction of entirely new ideas as the maturation of the field, as those ideas become vastly more accessible and localized. Since knowledge has to be applied, that’s potentially more powerful than “innovation” in the sense of novelty alone. Instead of relying of a handful of people to come up with all of the work, it means we could see surprising new thinking as the basic building blocks and tools of what we do spread.
Having taught my share of college courses and workshops, I’ve gotten to see this first-hand. You just watch fields get more interesting the more knowledge spreads to new people. So, it’s little surprise that fast-moving China would be writing about data visualization in Mandarin.
Onformative, biking distance from me, point to their Skype visualization project appearing in a new book. (See the original project.) The outline is in English and sounds dead-on interesting.
But, having said hello to our Russian friends last week (and in turn finding myself in various conversations about what’s happening in Russia), greetings, China. CDM is obviously biased toward native English speakers, but I know we have Chinese-speaking readers out there. And there, we really have the biggest obstacle – from search engines to the alphabet, it’s far harder to know about Chinese-language resources than Portugese or French and the like. Those of you who are there, where are you getting your information, as far as books and websites we might know about that aren’t in English?
http://book.douban.com/subject/7014933/
More info:
In prehistory, early humans created the first information graphics: cave paintings, later maps and now charts. In the age of internet, infographics seems to change the way people take in information.
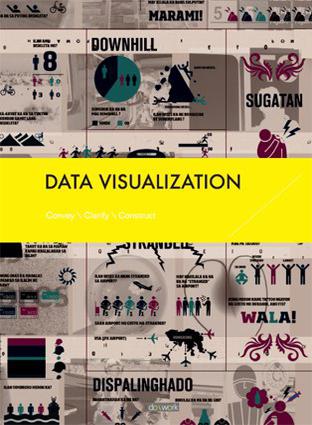
Data Visualization presents a comprehensive selection of innovative designed diagrams, ranging from maps to text-based diagrams, to process-based flow, to three-dimensional diagram…
I. Statistical Based Infographics
II. Text Based Infographics
III. TimeLine Based Infographics
IV. Process Based Infographics
V. Location or Geography Based Infographics
via http://www.onformative.com/