You’ve seen the Disney version of going inside the computer and seeing what happens, via Tron. Adam Marks has created an interactive art piece that visualizes the functions of actual computer software; in the samples below, code operating in Firefox.
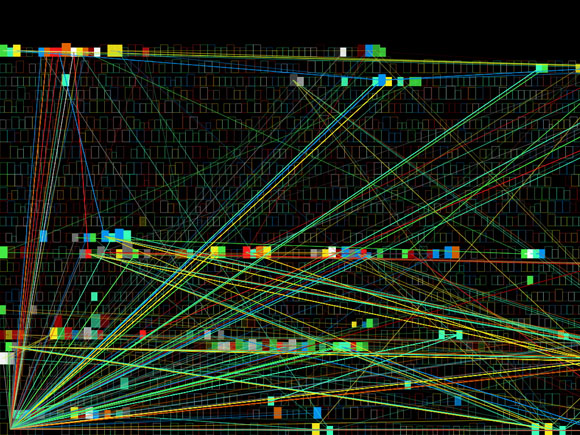
At the center of the work is Valgrind, a Linux-based debugger and profiler. Call data is fed to a Mac running custom OpenGL code, to turn calls in the program into visuals. The results are glitchy and syncopated, and strangely musical; you can see them in the video. There’s source code available, if you want to dig through it. The idea is to turn the operations of subroutines in the code into something visual.
VJing with a memory leak? Now that would be truly great.
Thanks, Adam!