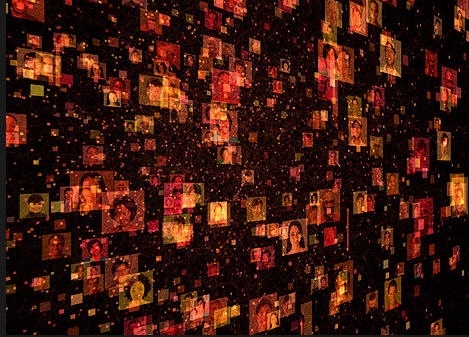
 Imagine VJing with a stream of live snapshots from partygoers — or playing live data from the Web on email statistics as though it were a musical/visual instrument. The ability of tools like Processing to make numbers fluid opens up new interfaces to the storehouses of data on the Web — but also makes them friendly to artists and visualists.
I’ll be doing a workshop at South by Southwest Interactive in Austin with S. Joy Mountford, formerly VP Design Innovation, Yahoo and leader of the Yahoo Design Innovation Team aka yHaus. Joy certainly knows her stuff — not only did she lead a ground-breaking team at Yahoo, but she’s also supported student work and research and has a long history in interaction design including working on the original QuickTime interface. We’ll talk about the work being done, where we think these technologies are going, and how you can give it a try yourself.
Data as Art: Musical, Visual Web APIs [Event Page, SxSWi]
5:00 pm – 6:00 pm, Sunday, March 9
Here’s the description of the Austin session:
New tools are making the data in our digital world more accessible and more expressive — even if number crunching isn’t usually your thing. With open APIs and open tools that let even non-programmers learn to code, there are new opportunities to make our Web-powered lives more meaningful.
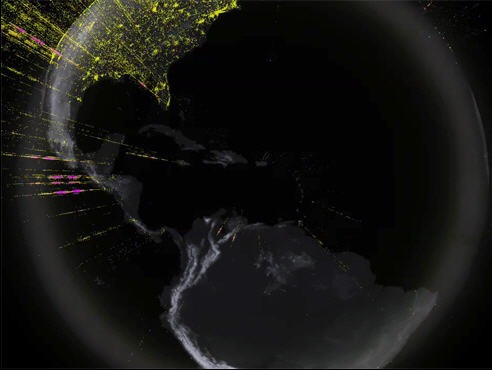
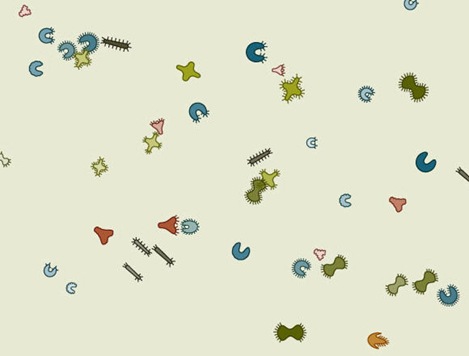
S. Joy Mountford, a pioneer in interface design and a veteran of the original QuickTime team, will show a series of visualizations that her team at Yahoo has produced. These show flight segments turned into dynamic parabolic trails of light, Yahoo Answers feeds showing key words as animated word clouds, the extent of mail traffic reach and topical search query bursts around the world. These displays are the start of an interactive, truly personal Web 3.0 environment. Some people described these applications as ‘useful’ art, but Joy thinks they may be a start towards a different type of interface.
Ready to try making these kinds of tools yourself? Peter Kirn, an educator, composer, and media artist, will give a hands-on overview of how you can begin to manipulate this data, even if you’re not a programmer. Using the free, open source tool Processing, you can translate Web data into three-dimensional animations or even real-time music.
There’s a certain irony to this workshop, which is the subject of Joy’s discussion — the output of yHaus — is now a bit of Web history; the whole design team was axed, according to reports. Then again, looking at the history of computer innovation, a lot of times the best ideas are recognized and realized on a wider basis much later. And, using Processing (with parallel information here on CDMotion), we hope to give you some of these tools for your own work.
If there are any doubts about the trend, there’s a similar panel at the ETech conference next week. I think the experience of VJing in a club or playing digital music live gives people a unique take on this, as data becomes not only “information” but expressive medium.
Information Visualization is a Medium [O’Reilly ETech]
If you make it to Austin, do say hi. And if not, watch for more online for the rest of the world.
Elsewhere:
Visualizing: tracing an aesthetics of data [Essay at We Make Money Not Art]
Julian Oliver : The Art of Gardening [Artist profile at Skynoise]
And blogs/resources on the topic:
visualcomplexity (huge gallery of stuff)
The emphasis is more on the information visualization side at each of those, but I think eventually the expressive potential of this stuff will emerge out of that.


